
Marketing ROI by channel cannot be compared fairly when every channel supplies a different numerator, denominator and time window. Paid search may report platform-attributed revenue divided by media spend. SEO may report analytics revenue divided by an agency fee. Events may include sponsorship but omit travel and staff time. Email may claim purchases from customers acquired elsewhere.
The apparent winner can therefore be determined by accounting boundaries rather than performance.
A fair comparison gives every channel the same customer outcome, contribution definition, cost boundary, cohort maturity rule and evidence standard. It then separates observed attribution from incremental impact and historical average return from the expected return of the next dollar.
Quick answer: Do not begin by ranking channels. Begin by normalizing the evidence. Calculate observed ROI, assess incrementality separately, show confidence beside the result and only then make a budget decision.
Define the two ROI questions
Marketing teams often use one percentage to answer two different questions:
- How did the channel perform at its historical scale?
- What is the expected return from the next unit of investment?
The first is an evaluation question. The second is an allocation question. Historical average ROI can remain positive while marginal return falls because the easiest audience has already been reached, auction costs rise or production capacity becomes constrained.
Use a finance-approved outcome. Revenue may be suitable for a top-line view, but contribution is usually more comparable when products, discounts, returns, fulfillment, commissions and variable support differ by channel. OpenStax defines contribution margin as sales less variable costs and explains how it contributes toward fixed costs and profit.
Observed ROI
Observed ROI uses the value assigned to a channel by the agreed reporting method:
Observed ROI = (attributed contribution - full channel cost) / full channel cost
It is useful for reconciliation and trend analysis. It is not proof that every assigned outcome would disappear if the channel stopped.
Incremental ROI
Incremental ROI uses the additional contribution estimated to have occurred because of the investment:
Incremental ROI = (incremental contribution - incremental cost) / incremental cost
Google's geo-based Conversion Lift documentation defines incremental return on ad spend as incremental conversion value divided by incremental cost. For cross-channel business decisions, replace platform conversion value with the finance-approved contribution measure where the data permits.
Do not relabel an attributed number as incremental. If no credible experiment or causal model exists, report an assumption range and lower the confidence grade.
Establish one comparison contract
Before collecting channel results, write a measurement contract that every row must follow.
| Field | Required definition |
|---|---|
| Eligible customer | The market, product, customer type and exclusions |
| Outcome | Activated account, retained purchase, implemented contract or another verified completion point |
| Value | Net revenue, gross profit, contribution or another approved measure |
| Cost boundary | Direct program cost and, where useful, fully loaded cost |
| Cohort | Acquisition or opportunity period used to group customers |
| Maturity window | Time allowed for conversion, retention, refunds and expansion |
| Attribution view | First source, session, opportunity source, last touch or influenced |
| Incrementality evidence | Holdout, geo test, staggered release, model, sensitivity range or none |
| Confidence | Quality of cost, identity, outcome, maturity and causal evidence |
Keep leads, qualified leads, opportunities and customers as separate stages. Comparing paid cost per lead with partner cost per customer is not a channel comparison.
Segment where economics differ materially. Enterprise and self-service customers, new and returning customers, domestic and international buyers, or products with different margins should not be averaged merely because they share an analytics channel label.
Map analytics channels to business programs
Google Analytics publishes default channel-group rules for classifications including Organic Search, Paid Search, Paid Social, Email, Referral, Affiliates and AI Assistant. Those definitions are useful reporting infrastructure, but they do not automatically match budget ownership.
Create a mapping between four layers:
- Platform: where media, messages or interactions were delivered.
- Analytics: how the visit or event was classified.
- CRM: how the person, account or opportunity was sourced and influenced.
- Finance: where cost and realized customer value are recorded.
Preserve unknown and direct traffic. Reassigning uncertainty to a favored program does not improve measurement. Keep acquisition and lifecycle roles separate too: email may convert an existing customer without being the channel that originally acquired that customer.
For a strategic comparison of what each acquisition channel can do, use the separate customer-acquisition channel guide. This article focuses on the financial normalization after those channel roles have been defined.
When the normalized evidence needs to become a portfolio decision, use the demand-generation budget allocation framework to set funding boundaries and review gates.
Include the full cost of each channel
The denominator must be consistent enough that a high-labor channel is not compared with a media-only denominator.
| Channel | Common direct and enabling costs |
|---|---|
| SEO | Technical work, content, engineering, design, digital PR, tools, agency or staff time, maintenance |
| Paid media | Media, management, creative, feeds, landing pages, measurement, experimentation |
| Partners and affiliates | Commission, revenue share, discounts, platform fees, enablement, management, fraud and support |
| Events | Sponsorship, venue, production, travel, speakers, staff, content, lead capture and follow-up |
| Outbound | Data, tooling, representatives, management, deliverability, research and sales content |
| Email and lifecycle | Platform, data, operations, creative, automation, consent management and deliverability |
Show direct program cost and fully loaded cost separately when allocation of shared website, analytics, CRM or management infrastructure would otherwise hide the decision.
Past setup costs and future decisions also need different views. OpenStax's guidance on relevant information for decisions explains that a sunk cost has already occurred and does not change between future alternatives. Retain historical setup cost when evaluating the original program, but do not pretend it is avoidable spending when deciding whether to fund the next quarter.
Align cohorts and maturity
Match cost to the cohort it was intended to create. Current revenue may come from work funded several quarters ago, while current investment may create customers later.
For every channel, document:
- cohort start and end dates;
- customer or opportunity inclusion rule;
- conversion lag;
- refund, cancellation and churn window;
- value observation period;
- treatment of incomplete cohorts.
Do not compare a mature organic-search cohort with last month's event attendees. Mark immature cohorts, show the observed portion and withhold a final return judgment until the agreed window closes.
Search also needs system reconciliation. Google's guide to Search Console and Analytics measurement explains that Search Console measures Google Search activity before arrival while Analytics measures on-site behavior, and that clicks and sessions use different definitions. Use Search Console for discovery, analytics for site behavior, CRM for qualification and finance for realized value. Investigate material differences without forcing the systems to match.
Separate attribution from incrementality
Attribution assigns credit. Incrementality estimates what would not have happened without the investment.
Google Analytics describes attribution as assigning credit to touchpoints along the path to an important action. Its available models include data-driven attribution and last-click variants. Those models can support reporting, but a credit allocation is not automatically a causal estimate for a complete business program.
Google describes lift studies as controlled experiments that compare a treatment group exposed to advertising with a control group that is not exposed. The difference estimates the increase driven by the campaign.
Use the strongest feasible method:
- randomized user holdout;
- randomized or matched geographic test;
- staggered rollout with a credible comparison group;
- calibrated marketing-mix or causal model;
- bounded sensitivity analysis when experimentation is unavailable;
- attribution only, clearly labeled.
Report attributed and incremental results side by side. Do not conceal a wide confidence interval, insufficient sample or incompatible experiment window.
Worked five-channel comparison
The following model is original SEO Companies Hub analysis created to demonstrate the method. All amounts are illustrative USD thousands, not industry benchmarks. “Incremental contribution” represents either measured lift or a stated planning scenario; a real report must identify which applies to each row.
| Channel | Full cost | Attributed contribution | Observed ROI | Incremental contribution | Incremental ROI | Evidence | Confidence |
|---|---|---|---|---|---|---|---|
| SEO | $120k | $216k | 80% | $156k | 30% | Bounded scenario | Medium |
| Paid search | $180k | $342k | 90% | $225k | 25% | Geo lift | High |
| Partners | $90k | $171k | 90% | $126k | 40% | Matched cohort | Low |
| Events | $160k | $240k | 50% | $136k | -15% | Staggered regions | Medium |
| Lifecycle email | $55k | $176k | 220% | $66k | 20% | User holdout | High |
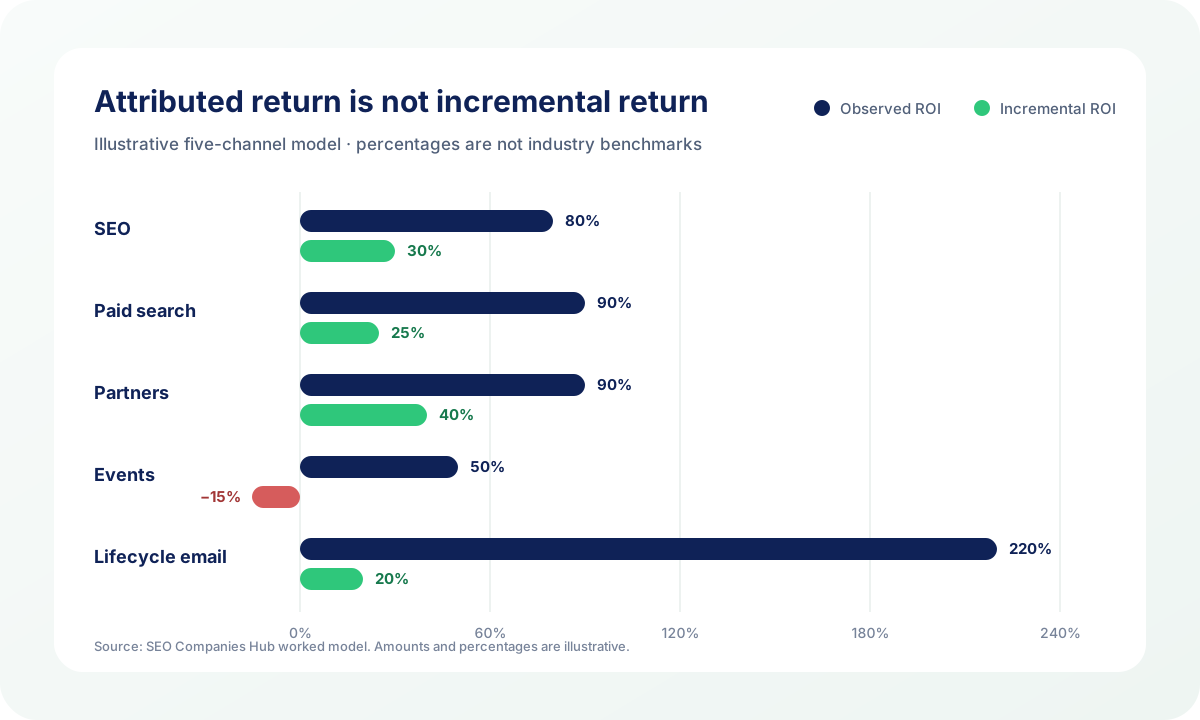
The calculations are reproducible. For SEO:
Observed ROI = ($216k - $120k) / $120k = 80%
Incremental ROI = ($156k - $120k) / $120k = 30%
Three decisions follow from the normalized table:
- Lifecycle email looks dominant in the attributed view but falls to 20% incremental ROI because much of the credited value came from customers created elsewhere.
- Partners have the highest incremental point estimate, but weak evidence means the result should be tested before receiving the largest increase.
- Events are negative in the observed test window. The next decision depends on cohort maturity, strategic account evidence and whether a repairable execution problem explains the result.
The table does not declare a universal winning channel. It shows where evidence is strong enough to scale, where a test is needed and where the current program needs repair or restraint.
Compare channel-specific biases
Apply one framework while retaining the limitations unique to each channel.
SEO
Include page, template, platform and maintenance investment. Separate branded from nonbranded discovery and allow for the time between publication, discovery, buyer progression and realized contribution. Do not count the same content-supported outcome again under sales enablement or paid media.
Use the SEO ROI calculator for a transparent scenario, then compare the assumptions with observed cohorts. For ecommerce-specific retention, product and category effects, see the ecommerce SEO ROI model.
Paid media
Reconcile platform-attributed events with unique downstream customers. Separate brand capture, retargeting and prospecting because they face different baselines. Include creative, management, landing-page and experimentation costs, not media alone.
Partners, affiliates and events
Separate referrals, resellers, technology ecosystems and coupon affiliates. Include commission, enablement, discounts, support and fraud. For events, include staff and follow-up, then match attendance to consented account and opportunity evidence over a realistic window.
Email and lifecycle
Separate acquisition, activation, retention and expansion. Email usually works with a known audience, so purchases after a message may reflect acquisition supplied by another channel. Holdouts and customer-state segmentation are especially important.
Move from average ROI to marginal ROI
Average historical ROI describes the program at its past scale. Budget allocation requires the expected return from the next unit of spend.
Google's Meridian documentation distinguishes ROI and marginal ROI and supports channel-level contribution and budget-optimization analysis. A real marginal forecast should consider:
- remaining eligible audience;
- auction or placement saturation;
- content and engineering capacity;
- sales and onboarding constraints;
- response curves;
- uncertainty in the underlying model;
- strategic dependence on one platform or partner.
Show downside, base and upside scenarios. The SEO forecast calculator can structure a search scenario, while the SEO CAC calculator helps reconcile acquisition cost with customer economics. Neither tool turns an assumption into an observed result.
Grade confidence beside every result
A precise percentage can still be weak evidence. Grade each channel using six controls:
| Control | High-confidence condition |
|---|---|
| Cost completeness | Direct and enabling costs reconcile to finance |
| Customer identity | Duplicate people and accounts are resolved |
| Outcome reconciliation | Channel outcomes reconcile to total customers and value |
| Cohort maturity | The agreed conversion and value window has closed |
| Incrementality | A credible experiment or calibrated causal model exists |
| Sample and uncertainty | Counts, intervals and limitations are disclosed |
Use High only when material controls are satisfied. Use Medium when the result is decision-useful but depends on bounded assumptions. Use Low when missing cost, immature cohorts, identity gaps or attribution dependence could reverse the ranking.
The SEO KPI plan builder can help separate discovery, behavior and commercial measures before they are assembled into the ROI view.
Build the operating report
The production comparison table should contain:
- channel and business role;
- eligible customer and cohort;
- direct and fully loaded cost;
- net contribution;
- observed ROI and attribution model;
- incremental estimate and method;
- payback or maturity status;
- marginal scenario;
- confidence grade;
- owner, decision and next review date.
Accompany percentages with raw counts and amounts. Explain which assumption dominates the conclusion and what action follows: scale, test, repair, continue or stop.
Review fast operational signals weekly where necessary, but align economic decisions with the channel's feedback speed. Mature channel economics may need monthly or quarterly review. Protect long-horizon programs from daily noise without granting them immunity from milestones.
Final verdict
Marketing ROI by channel is fair only when every channel faces the same customer, cost, contribution, cohort and evidence standards.
Observed ROI explains how value was assigned under the reporting contract. Incremental ROI asks what additional value the investment caused. Marginal ROI asks whether the next dollar is expected to perform like the historical average. These figures should sit together, not be collapsed into whichever percentage makes a channel look strongest.
Normalize first, disclose uncertainty, and make the budget decision from the complete evidence—not from a platform leaderboard.
Sources checked
- Google Analytics: Get started with attribution
- Google Analytics: Default channel group
- Google Search Central: Using Search Console and Analytics data
- Google Ads: About lift studies
- Google Ads: Geo-based Conversion Lift measurement
- Google Meridian: ROI, marginal ROI and contribution parameterizations
- OpenStax: Contribution margin
- OpenStax: Relevant information and sunk costs